Many people use the standard Python debugger (pdb or ipdb) because it works
well and can be used as a standalone tool or with your favorite editor. I’ve used it for
years, but today I’m more productive using the PyCharm debugger. It can debug Python,
JavaScript, and Django and Jinja Templates (making the debugging process seamless in web
applications). Also, I don’t have to worry about leaving pdb.set_trace calls around
anymore.
Since the process to run and debug code in PyCharm is similar, we will look how to run code first (jump to the debugging section if you already know how to run code in PyCharm).
In this article shortcuts are written with the first letter of keyboard modifiers followed by the actual keys in lower case. The keys are presented for both OS X and Windows/Linux in the format (mac, win). For example, the shortcut (⌘-S-⌥-t, S-A-C-t) means to press the keys ⌘, Shift, Option, and t at the same time on the Mac, and Shift, Alt, Control, and t on Windows and Linux. When only one shortcut is presented, it will be the same on all operating systems.
Running Python Code
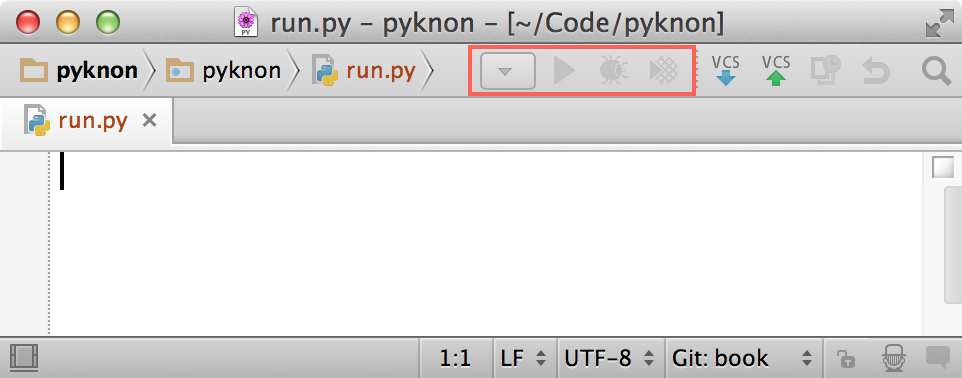
If we haven’t run any code in our project before, the icons to run and debug will be disabled:
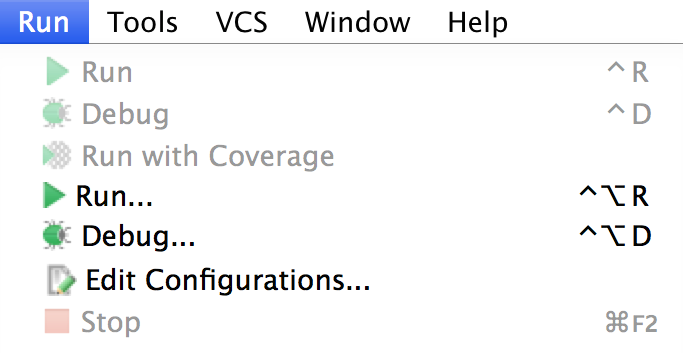
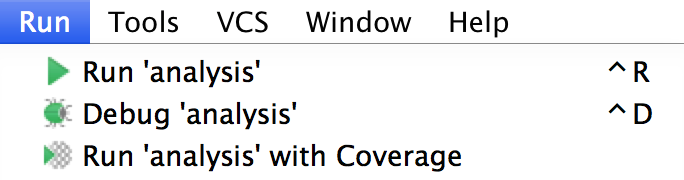
Some items will be disabled in the Run menu as well:
To run a script for the first time, we need to either create a configuration (Run→Edit
Configurations…) or ask PyCharm to run the current file by going to
Run→Run… (⌥-C-r, A-C-r), where PyCharm will automatically offer to run the
current file. In the following example I’m editing a file named analysis.py. Notice how
PyCharm creates a new configuration named analysis:
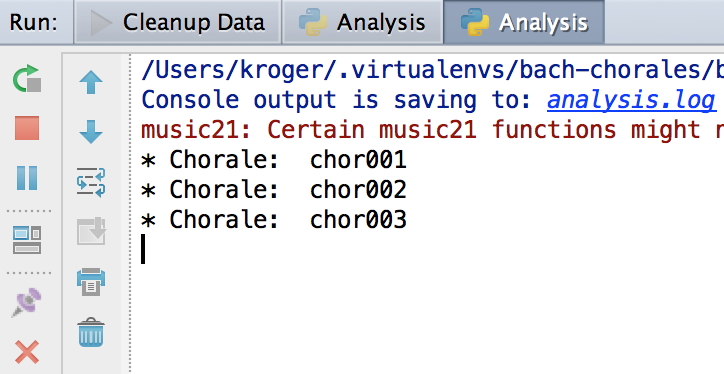
PyCharm will run the file and show a tool window with the results, if any.
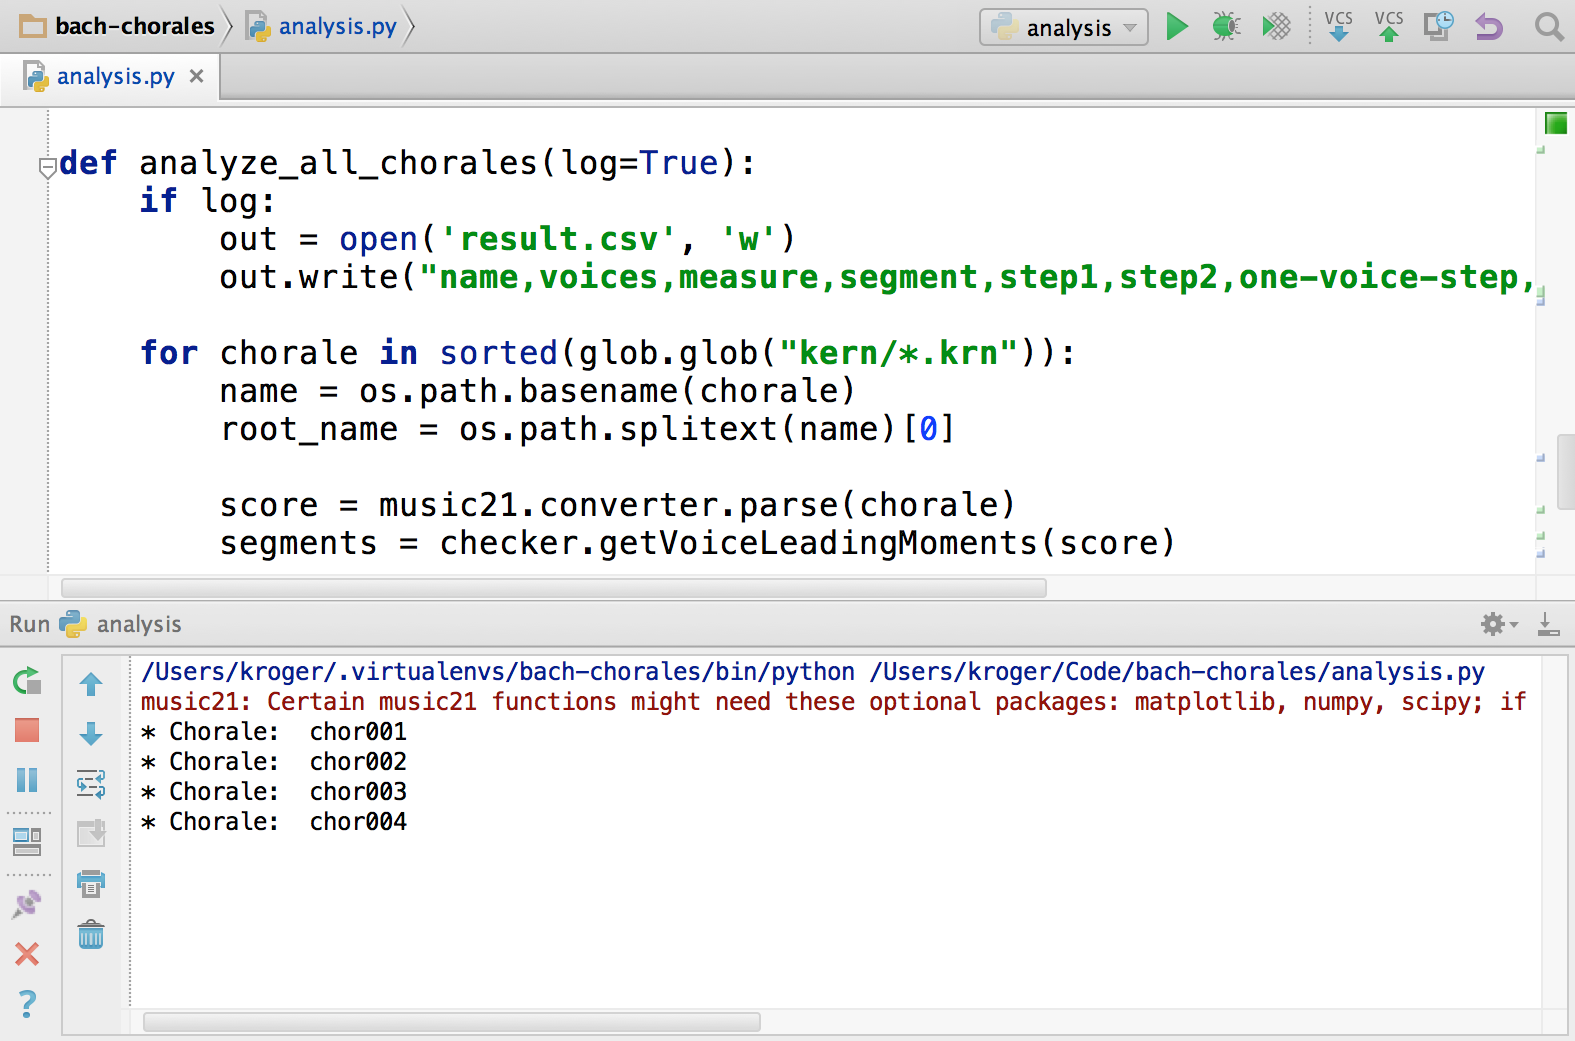
The Run tool window has many buttons to help us deal with the running script. We can do things like pause, stop, and rerun the script and move up and down the stack trace.
![]()
The following table summarizes the main actions. The manual has a complete description.
| Name | Shortcut | Description |
|---|---|---|
| Rerun | `(⌘-r, C-F5)` | Stop the current process and run it again |
| Stop | `(⌘-F2, C-F2)` | Stop the current process |
| Pause Output | Keep running the process but don’t show its output | |
| Restore Layout | Restore the default window layout, discarding the current one | |
| Pin Tab | Run code on a new tab | |
| Close | `(⌘-w, S-C-F4)` | Closes the current tab and terminate the process |
| Up the stack trace | `(⌘-⌥-↑, A-C-↑)` | Navigate up the stack trace |
| Down the stack trace | `(⌘-⌥-↓, A-C-↓)` | Navigate down the stack trace |
| Use Soft Wraps | Enable word wrap for long lines | |
| Clear All | Remove all text in the console |
We can hide the Run tool window with (⌘-4, A-4).
Once a script is run for the first time, it becomes available in the Run menu. PyCharm
will show the most recently run command in Run→Run '<script name>' (C-r, S-F10), where
<script name> is the name of the Python file without the extension (analysis, in our
previous example).
This command will run the original file even if we are working on a different one. In our
example, if we are editing a different file (say chorales.py) and type C-r on the Mac
or S-F10 on Windows or Linux, PyCharm will run the file analysis.py, since this is
the last file we ran. This is useful when we have a master script and are making
modifications to a sub-module, for instance.
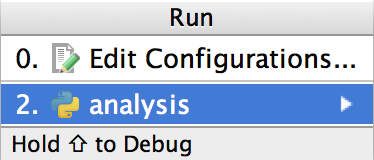
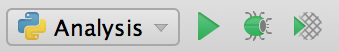
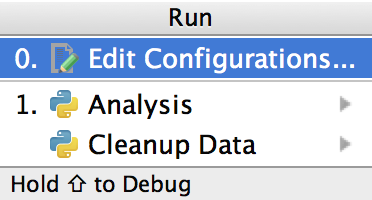
After we run the script for the first time, the related commands in the menubar will be available, and we can choose the script to run there:
PyCharm will create a new tab every time we run a script. If we don’t close the previous tab we may end up with many different tabs, so make sure you close each tab after running, and are, in fact, on the right tab.
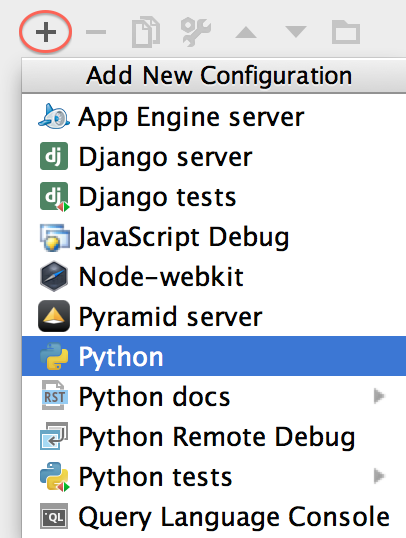
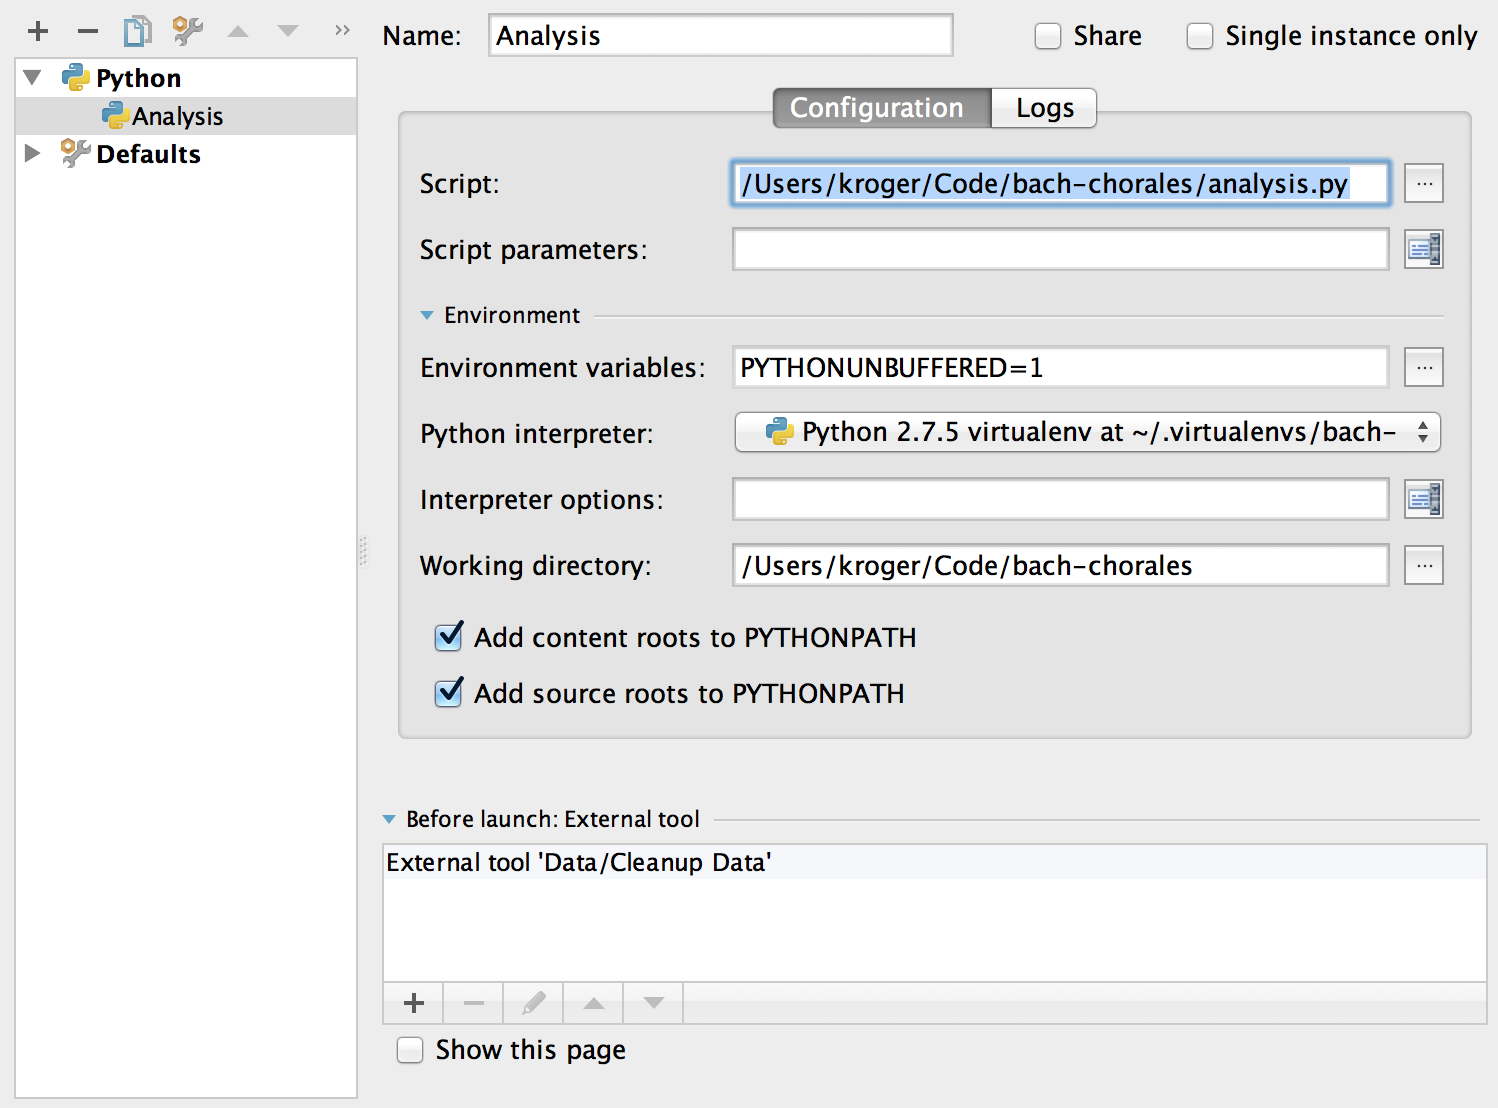
New Configuration
When we want to run things with more control we need to create a configuration by going to Run→Edit Configurations… and clicking on the + button (⌘-n, A-Insert). PyCharm will ask what type of configuration we want (that is, if we want to run a Python script, a Django or Pyramid server, and so on) and will show the appropriate options for each type.
We can choose the script to run, passing parameters if necessary, the Python interpreter, and the working directory. We can also launch an external tool before running the script, which is great if we need to do things like data pre-processing.
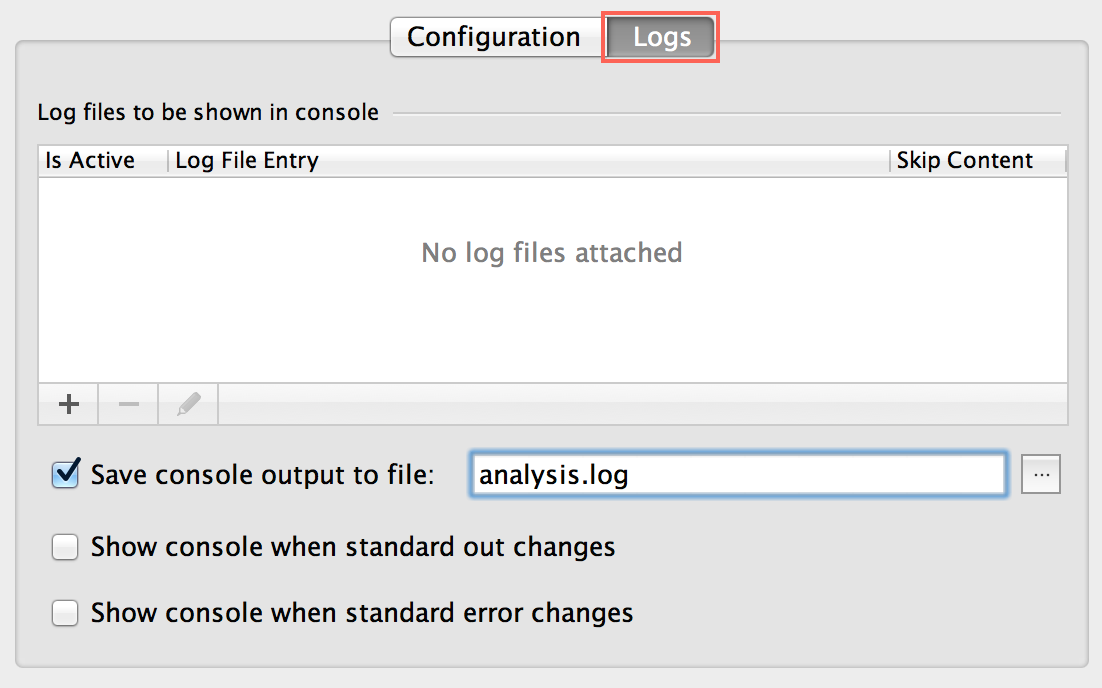
In the Logs tab we can add log files to be shown in PyCharm’s console during the script execution or save the console output to a file.
Naturally, we can have multiple configurations; we can switch between them by going to Run→Run… (⌥-C-r, A-C-r) and picking the one we want.
The Python Debugger
To debug code in PyCharm, we need to create a new configuration in Run→Edit
Configurations… or debug an existing script by going to Run→Debug…
(⌥-C-d, S-A-F9). After that it will be available in
Run→Debug '<script name>' (C-d, S-F9), where <script name> is the name of the Python
file without the extension (analysis, in our example). As you can see, it works just
like running code.
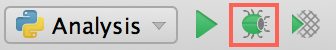
Similarly to the Run command, the menubar will now be enabled and we can choose the
script to debug by clicking on the insect icon.
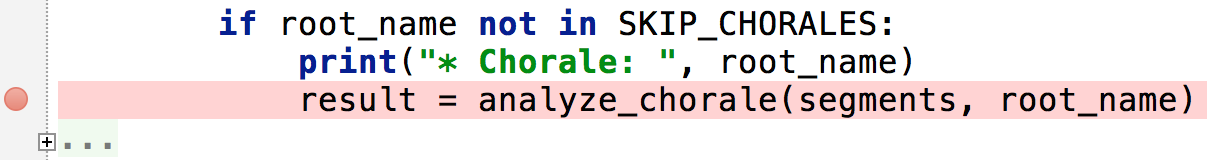
One of the main differences between running and debugging a script is that in debugging we want to define breakpoints. In PyCharm, a breakpoint must be on a line with working code; it can’t be on a line that is blank or starts with a comment. We create breakpoints by clicking on the gutter on the left.
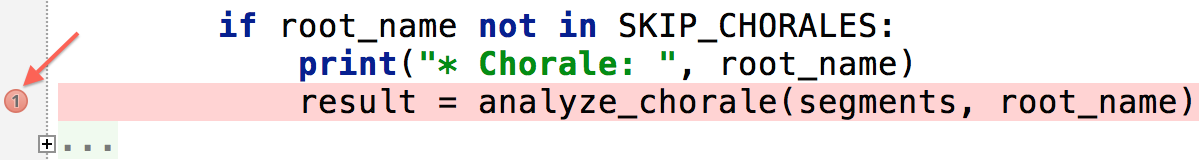
We can also create a temporary breakpoint by Alt-clicking on the gutter. As the name suggests, a temporary breakpoint will be removed after being hit. Notice that the temporary breakpoint icon is different from the regular one. Check the manual for more information about breakpoint icons.
PyCharm’s debug tool window has everything we expect in a graphical debugger. From here we can navigate the call stack and inspect the data available in each stack frame. We can keep an eye on some variables by adding them to the watch list.
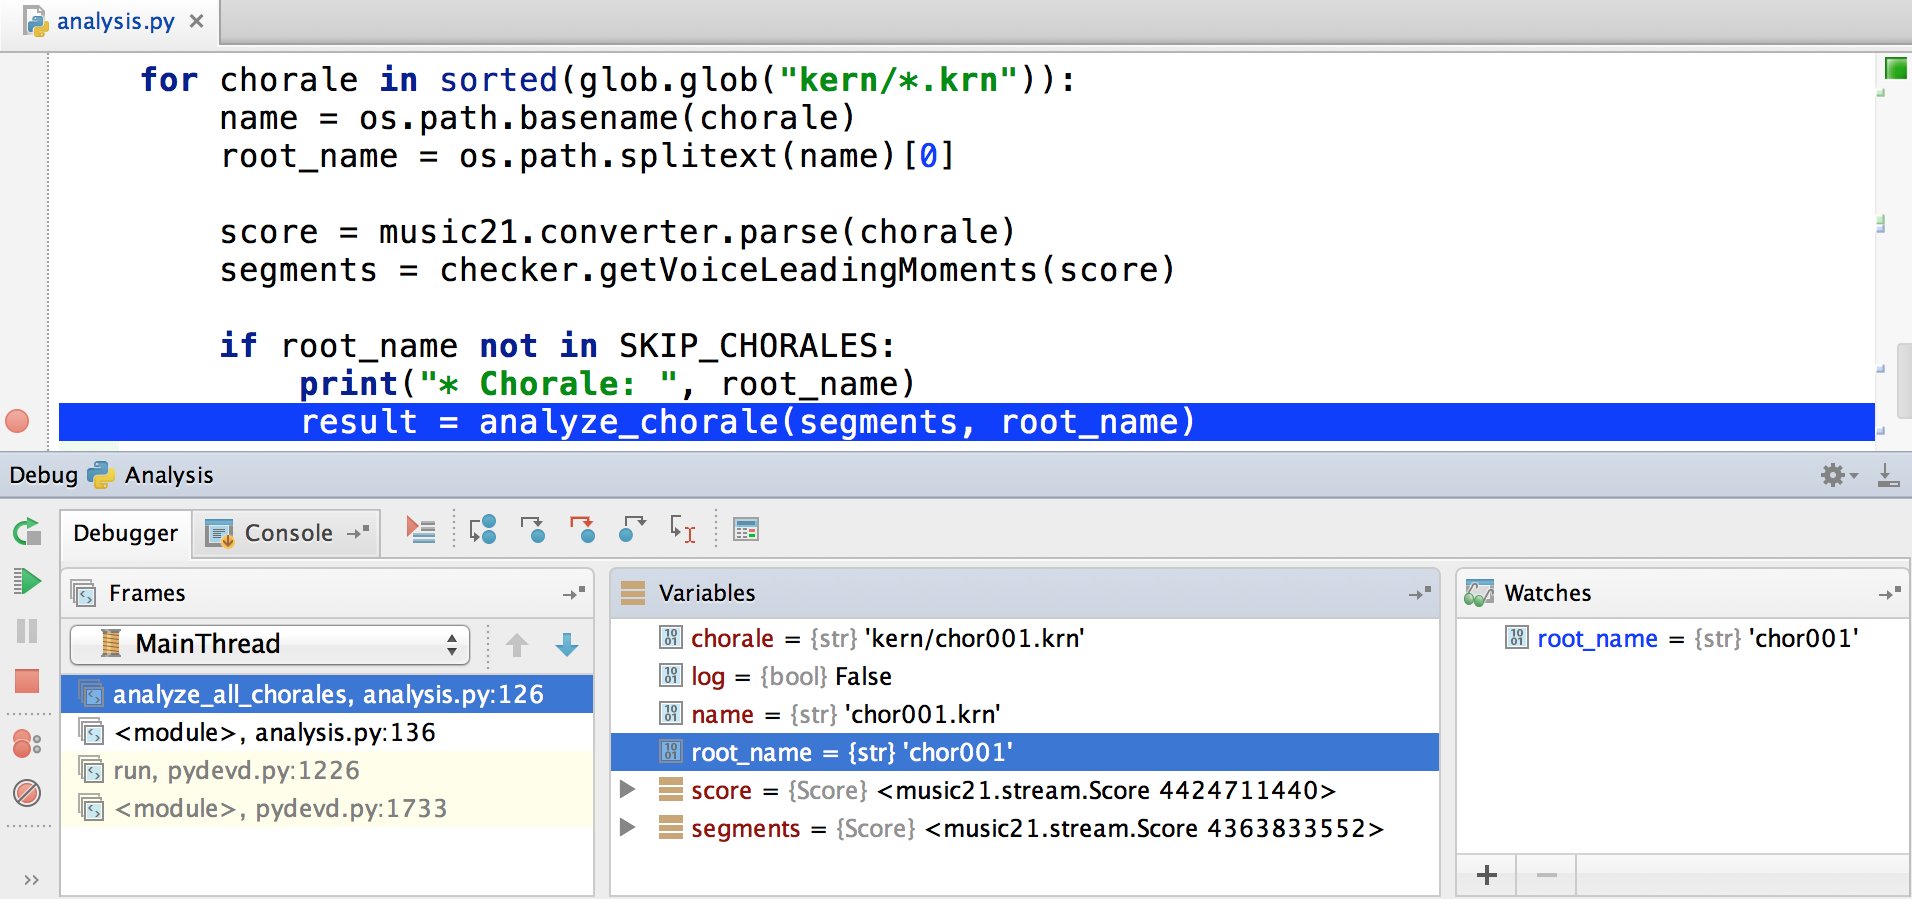
The debug tool window has many of the buttons we have seen in the Run tool window, allowing us to pause, stop, and rerun the script. In addition, we can view the breakpoints—also available in Run→View Breakpoints… (⌘-S-F8, S-C-F8)—and mute (that is, disable) all breakpoints.
![]()
The icons in the top right corner, allowing us to step in and out of the program, are the ones we will use the most:
![]()
In the following image, we can see each icon with its name. The table below shows the name, shortcut, and description for each icon.
![]()
| Name | Shortcut | Description |
|---|---|---|
| Show Execution Point | `(⌥-F10, A-F10)` | Go back to the execution point. Useful if we visit other files and want to go back |
| Step Over | `(F8)` | Step to the next line |
| Step Into | `(F7)` | Descend into a method or function call on the next line |
| Force Step Into | `(S-⌥-F7, S-A-F7)` | Descend into the method even if it’s to be skipped |
| Step Out | `(S-F8)` | Return to the line where the current function was called |
| Run to Cursor | `(⌥-F9, A-F9)` | Run the code where the caret is located. Useful to skip stepping over uninteresting code |
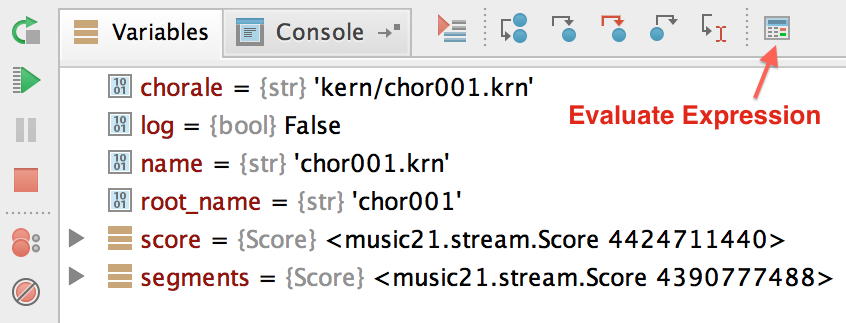
| Evaluate Expression | `(⌥-F8, A-F8)` | Evaluate an expression or code fragment |
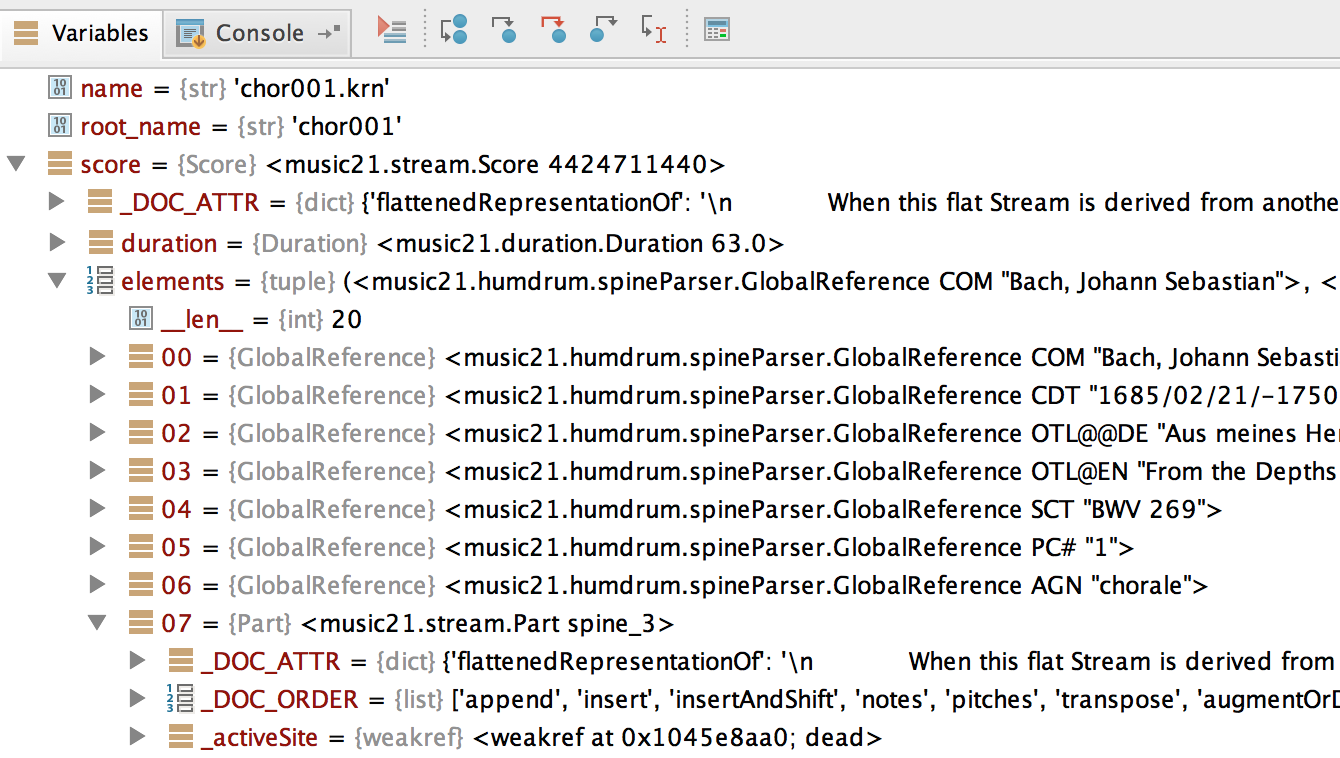
The variables pane is a great way to explore complex data. It was invaluable when I was
learning Django and getting acquainted with the HttpRequest object, for instance. In
the following example, we can see some music21 data, especially the complex Score
class. The Variables pane helps me to inspect attributes such as duration and
elements.
We can see all breakpoints in Run→View Breakpoints… (⌘-S-F8, S-C-F8). From here we can add, remove, or edit breakpoints; and set conditional breakpoints and log messages or expressions.
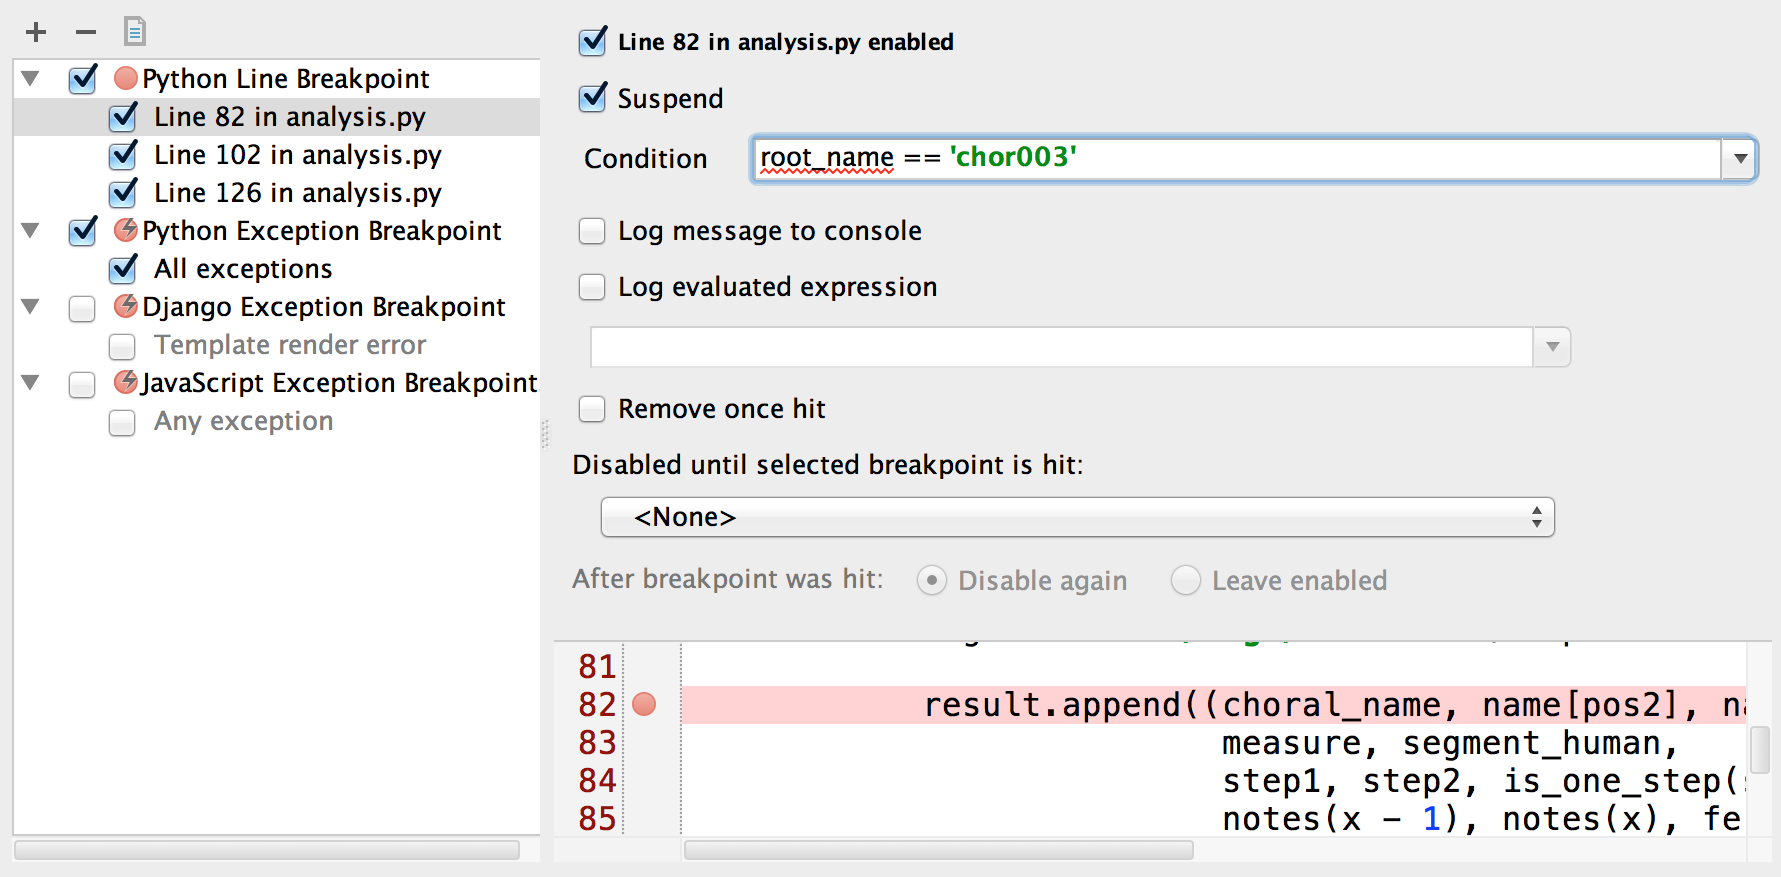
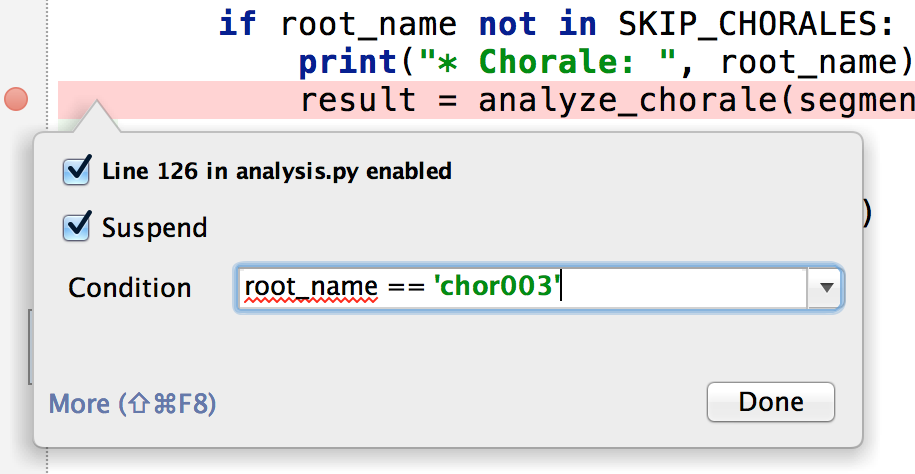
One way to quickly edit a breakpoint is to right-click on the breakpoint on the gutter. A popup will allow us to enable the breakpoint and add a condition.
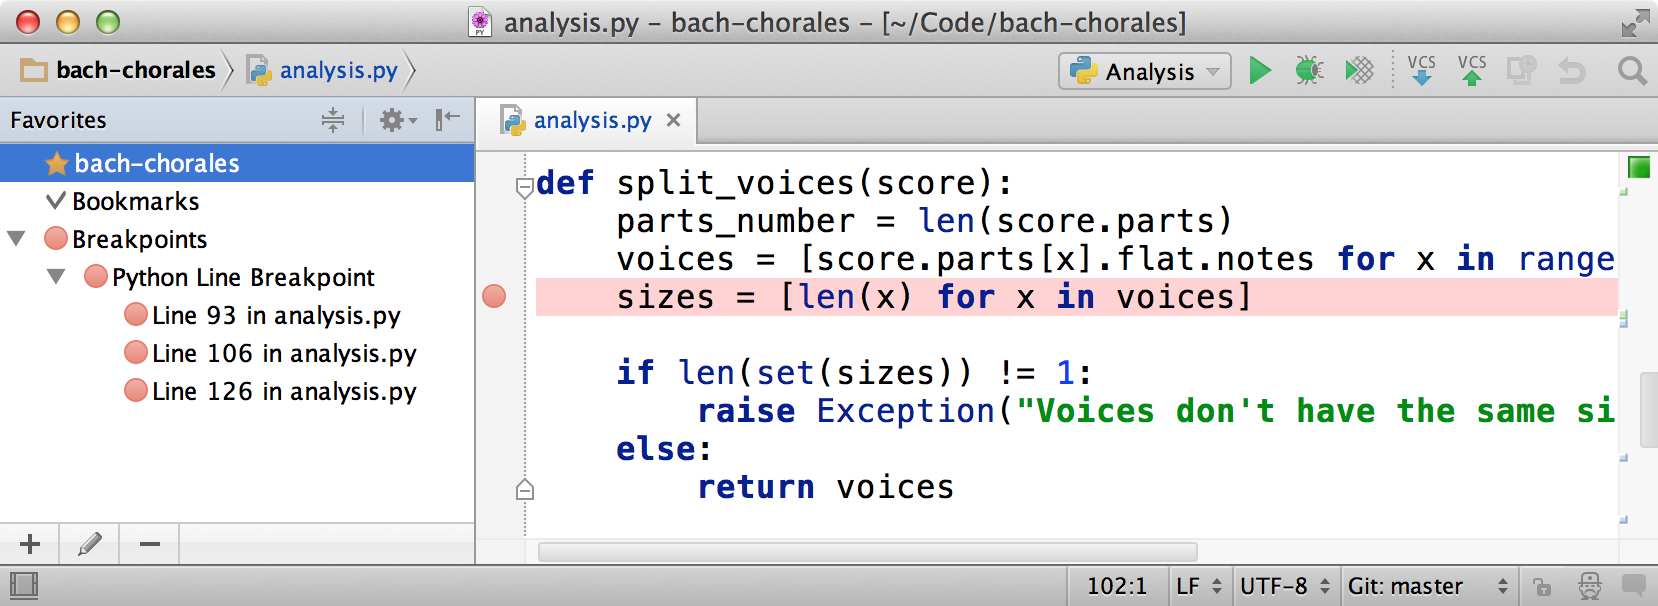
We can also see the breakpoints by selecting the Favorites Tool (⌘-2, A-2).
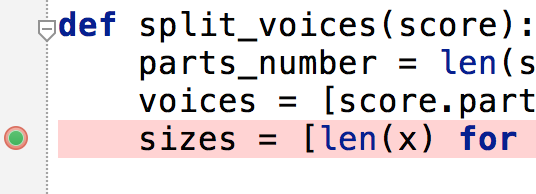
A quick way to disable a breakpoint is by clicking on it with the Alt key. The breakpoint icon will change.
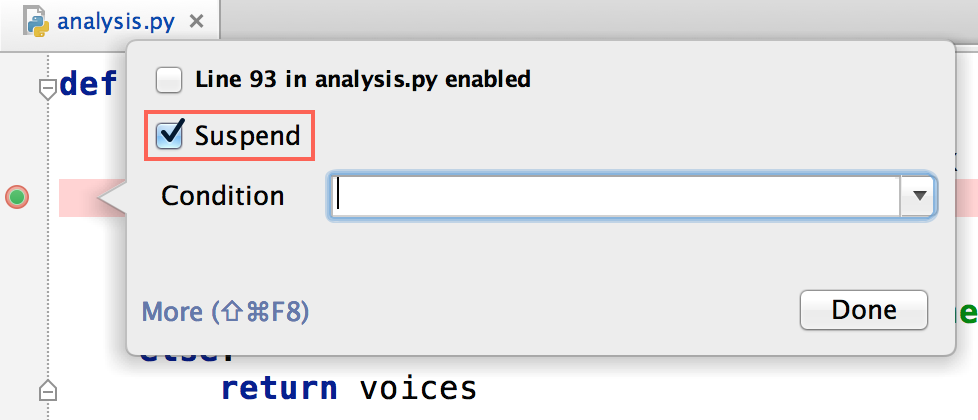
Another way to disable a breakpoint is by right-clicking on it and unchecking the first option (“Line 93 in analysis.py enabled” in the following example).
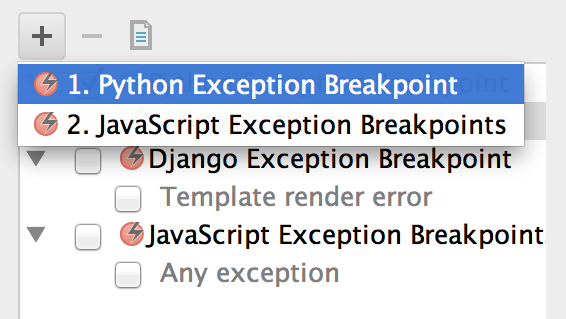
Besides defining breakpoints when a line of code is reached, we can define a breakpoint that is triggered when an exception is thrown. To add an exception breakpoint, we go to Run→View Breakpoints… (⌘-S-F8, S-C-F8) and select Python Exception Breakpoint after clicking the + button.
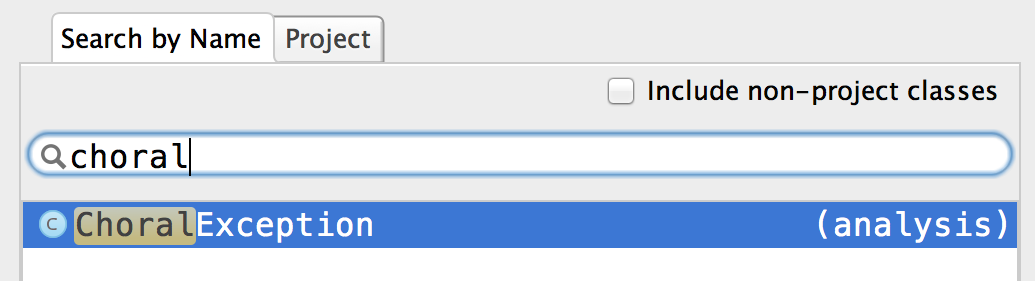
We need to include the exception class by searching for its name. The search field works with both built-in and custom exception classes.
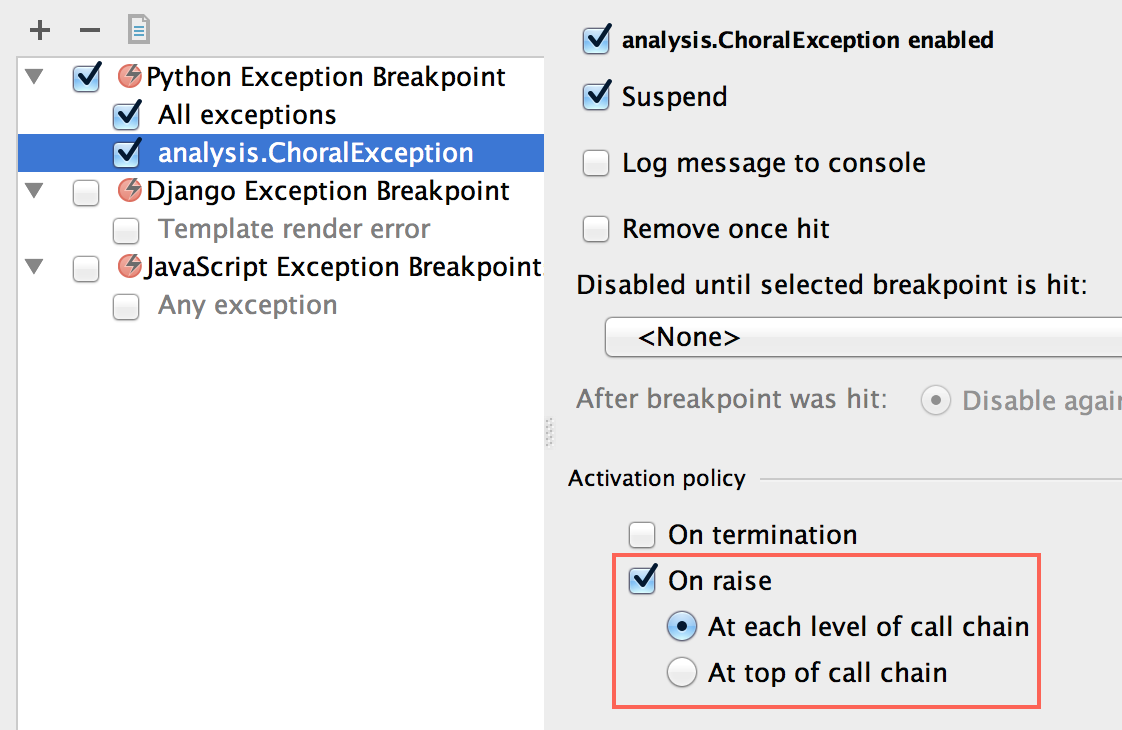
Our new exception now appears on the list, where we can customize it.

In most cases, we want to activate the breakpoint when the exception is raised (the default is to activate the breakpoint when the exception terminates):
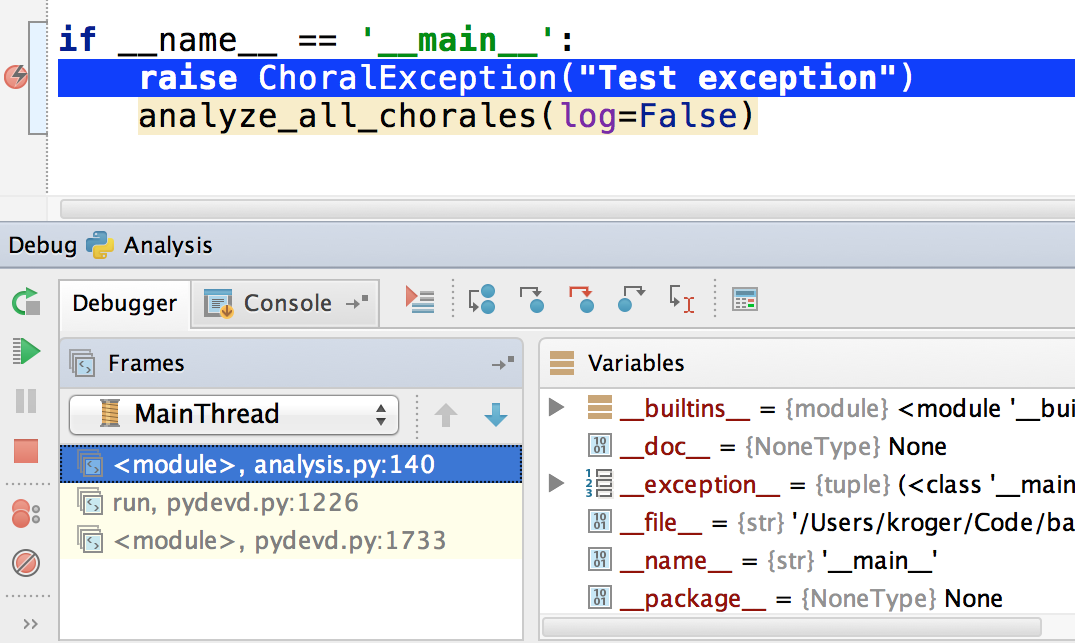
Having configured an exception breakpoint, PyCharm will create the breakpoint
automatically when the exception is raised (ChoralException, in our example). Notice
that the exception breakpoint icon is different from the regular one.
Python Prompt
Sometimes it’s useful to be able to access a Python prompt while debugging. We can do this by clicking on the Console tab when the debugger is running and selecting the Show Python Prompt icon.
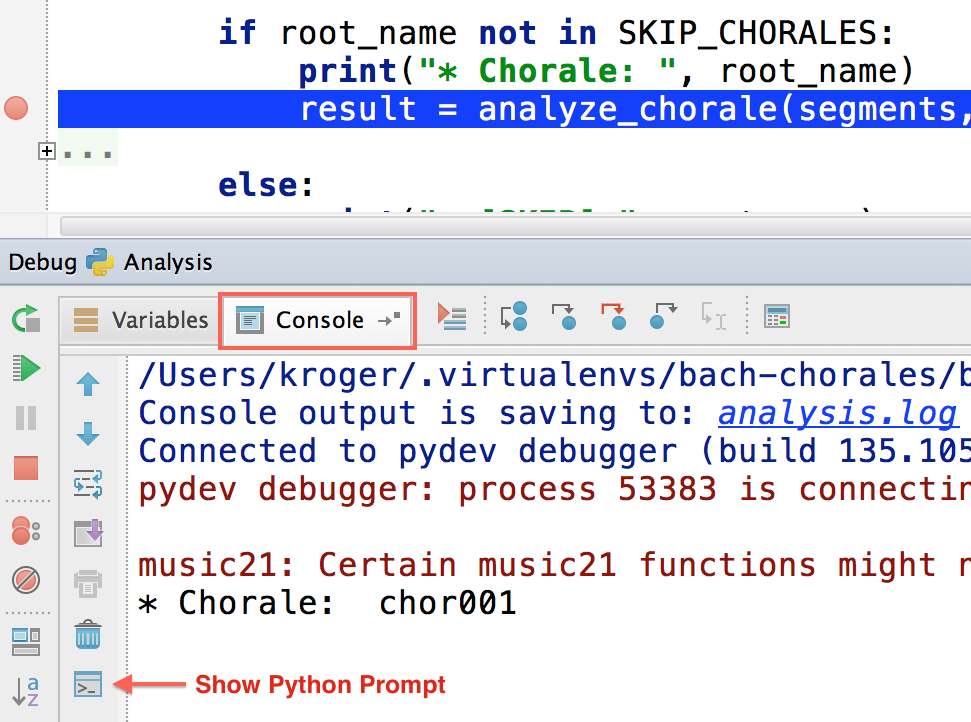
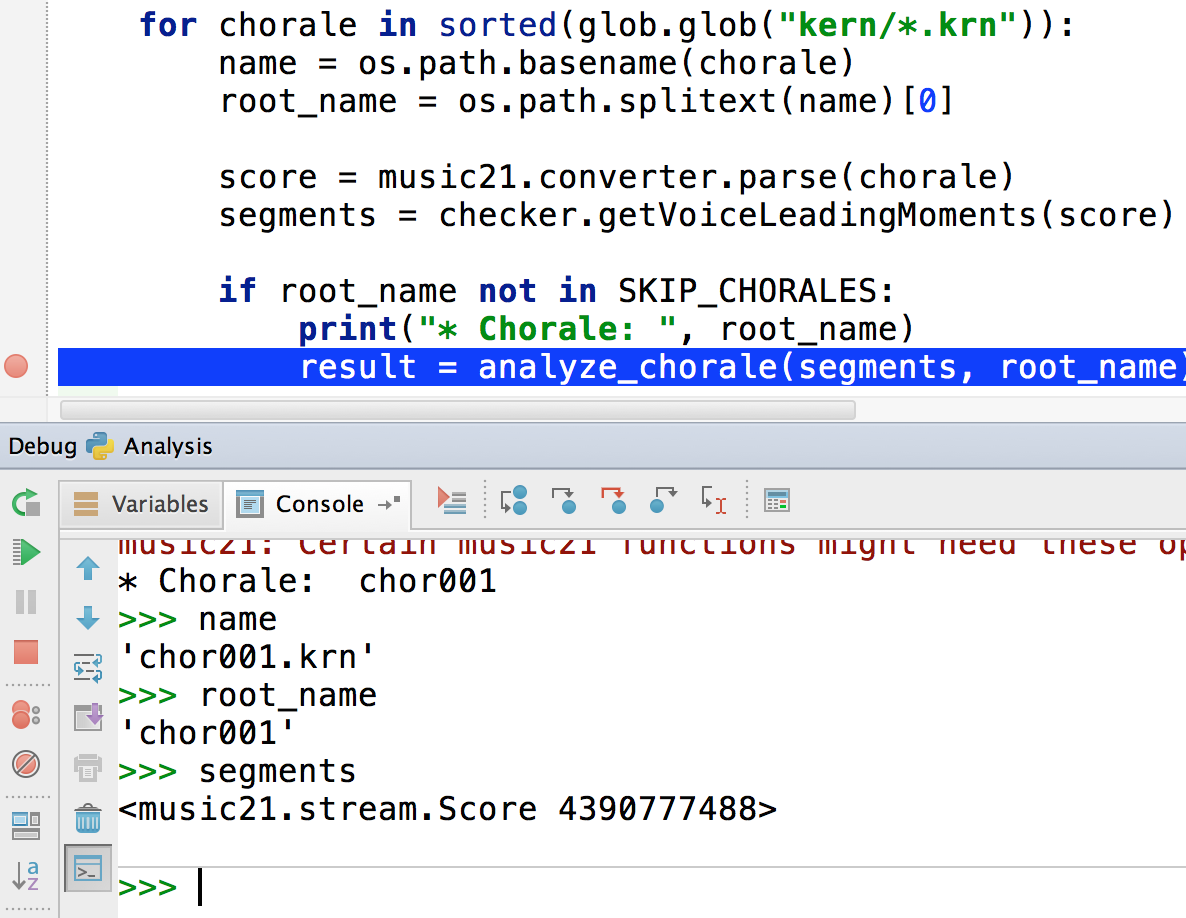
Now we can use the prompt to inspect and change the variables in the current scope.
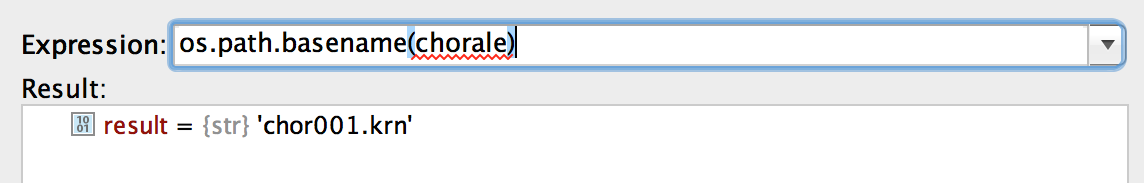
Evaluating Expressions
Although it’s super-useful to have a full Python prompt available while debugging, the Evaluate Expression feature may be sufficient if we just want to quickly evaluate an expression.
As expected, we can use any variable in the current scope:
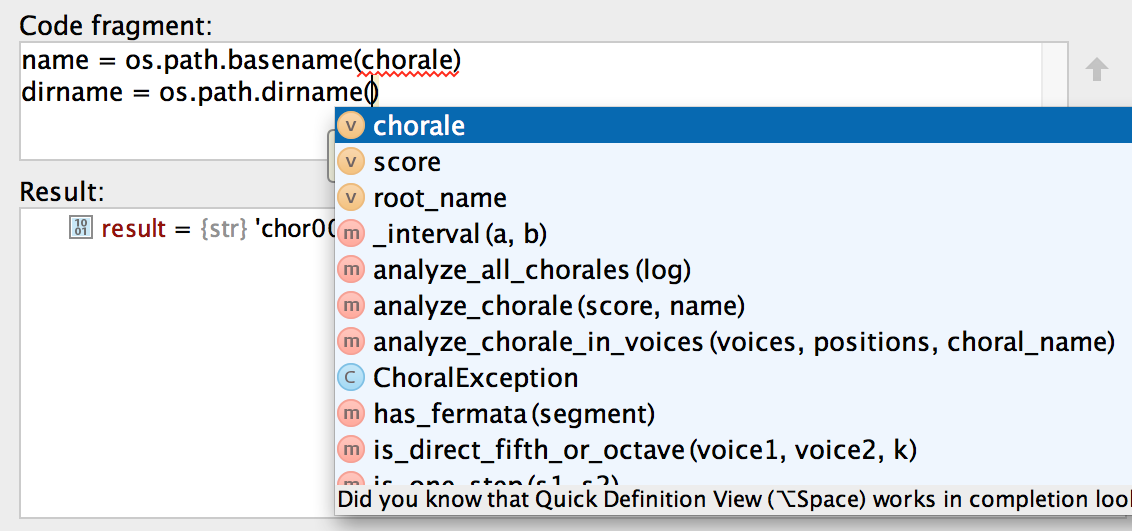
If we select the Code Fragment Mode button, we can add multiple lines of code. Completion works here as usual.
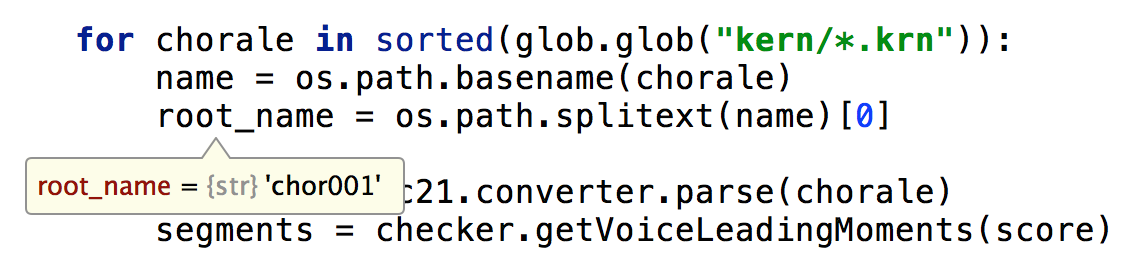
Inspecting and Watching Variables
The fastest way to inspect the value of variables while debugging is by hovering the cursor over a variable name. PyCharm will show the variable name and its value.
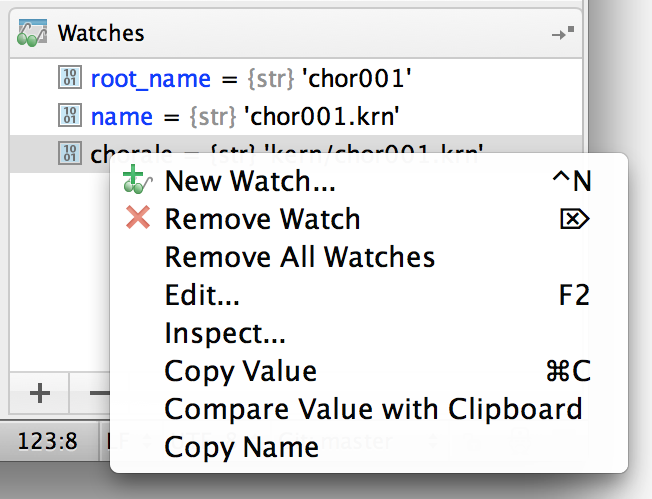
And, as expected, we can inspect and set a variable value by choosing the correct option in the popup menu on the Variables pane.

The same apply to watched variables; we can edit and inspect them by using the popup menu.
Remote Debugging
PyCharm has support to debug code remotely. Probably, the most popular and useful way is to debug code in a Vagrant box.
Conclusion
PyCharm has a debugger that is second to none. If you want to learn more about PyCharm and how to use it to debug JavaScript and Django templates, check my ebook, Modern Python Development with PyCharm.